DePaul’s new transfer students* have consistently strong retention and graduation outcomes, and the recently released outcomes data confirm this.
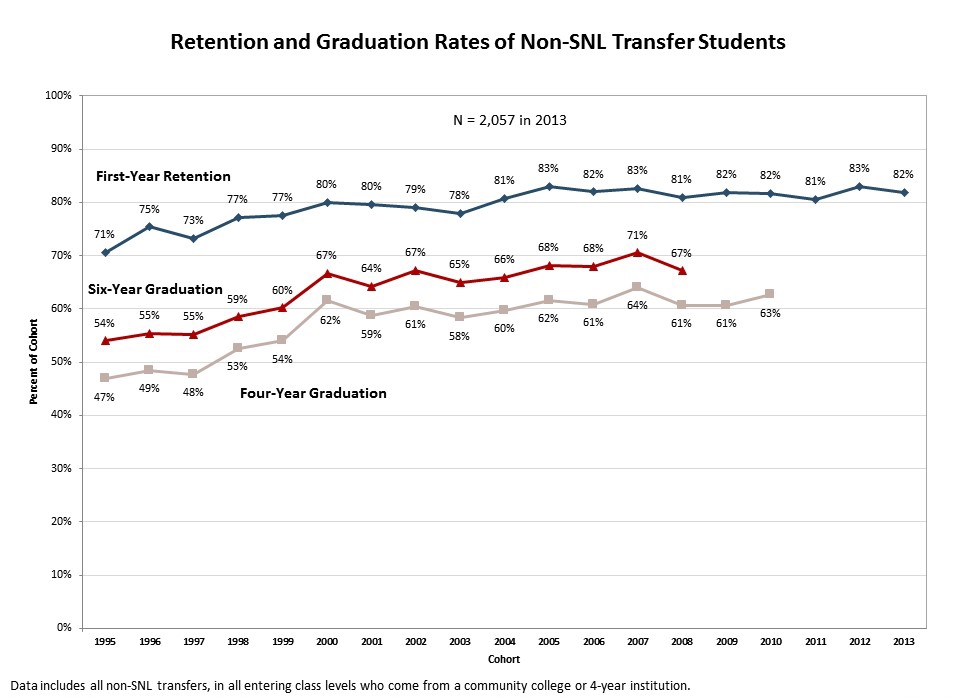
The first-year retention rate of 82 percent for the 2013 cohort of transfer students marked the tenth straight year it has been above 80 percent.
The four-year graduation rate for transfers increased by two percentage points over the prior year and is now at 63 percent. This is the second-highest rate of the past 10 years and marks the seventh straight year over 60 percent.
 Click to enlarge chart illustrating retention and graduation rates of non-SNL transfer students.
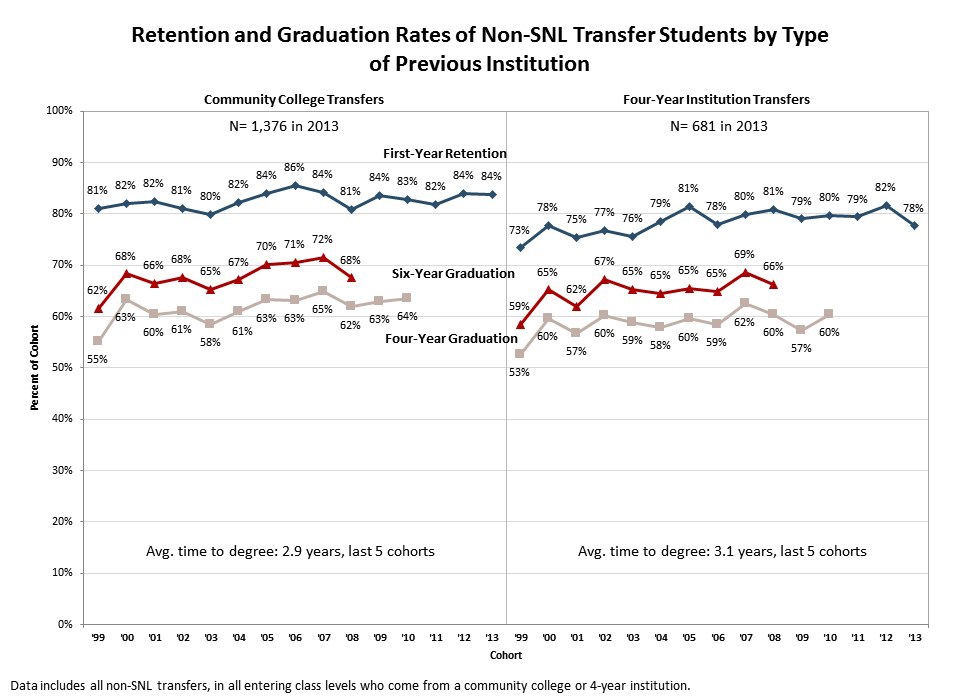
While the majority of transfer students (nearly two-thirds) come from community colleges, their retention and outcomes data compares favorably to those from four-year institutions. On the whole, community college transfers outperform transfers from four-year institutions by a slight margin.
In total, 84 percent of community college transfers persist to their second year, 64 percent graduate in four years and 68 percent graduate in six years. Of four-year transfers, 78 percent persist to their second year, 60 percent graduate in four years and 66 percent graduate in six years. These retention and graduation rates are comparable to those of students who start at DePaul as freshmen. (Read more about DePaul's freshman retention and graduation rates).
Of those transfers who have graduated, the average time to degree for community college transfers and four-year institution transfers is comparable at 2.9 and 3.1 years, respectively.
 Click to enlarge chart illustrating retention and graduation rates of non-SNL transfer students by type of previous institution.
Comparing transfer student outcomes to other universities is difficult because the federal government does not require it to be reported. However, the Student Achievement Measure (SAM), which
DePaul joined in 2015, provides an alternative to the federal graduation rate that is a more accurate representation of outcomes for students seeking bachelor’s degrees and offers the ability to evaluate transfer student outcomes across institutions. To see how DePaul compares to other institutions, visit
studentachievementmeasure.org.
DePaul’s Executive Retention Group (XRG) oversees the university’s retention strategy. Data and other information developed for the XRG are available on the Student Retention at DePaul
website. For additional questions about DePaul’s retention and graduation rates, contact
Liz Holder.
*Rates reported here for new transfers do not include students enrolled in the School for New Learning (SNL). SNL transfers have been excluded from this analysis because they are in a non-traditional program with less consistent enrollment patterns; in addition, SNL students may or may not transfer in credits.