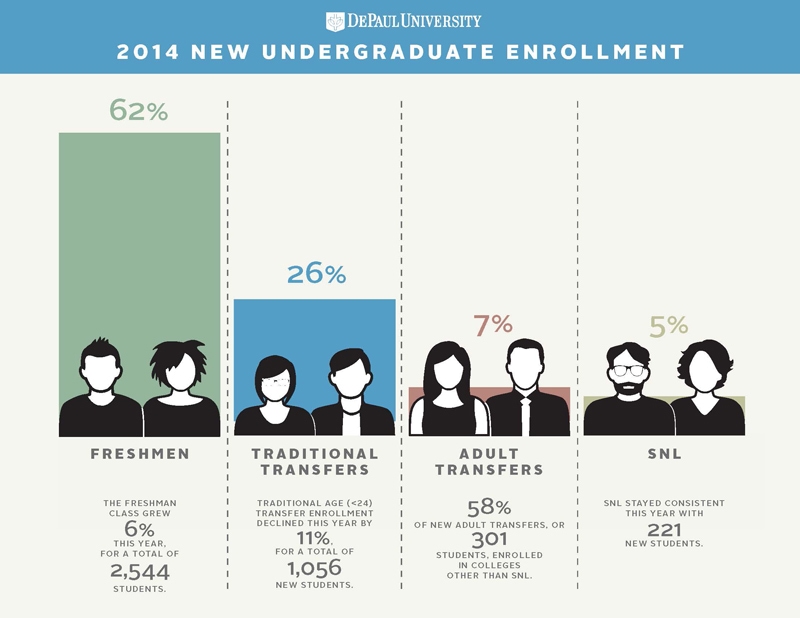
 An infographic depicting 2014 new undergraduate enrollment.
With an origin dating back over 200 years, infographics have become much more prevalent recently as data have become increasingly comprehensive and complex. They are useful tools that translate sophisticated and detailed information in an easy-to-consume format. Two EMM departments,
Institutional Research and Market Analytics and
University Marketing Communications, collaborated recently to produce a set of infographics displaying the characteristics of incoming freshman and transfer students (both traditional age and adult transfers).
Click the "full screen" arrows in the upper right corner below to learn more about new DePaul undergraduates enrolling this fall.
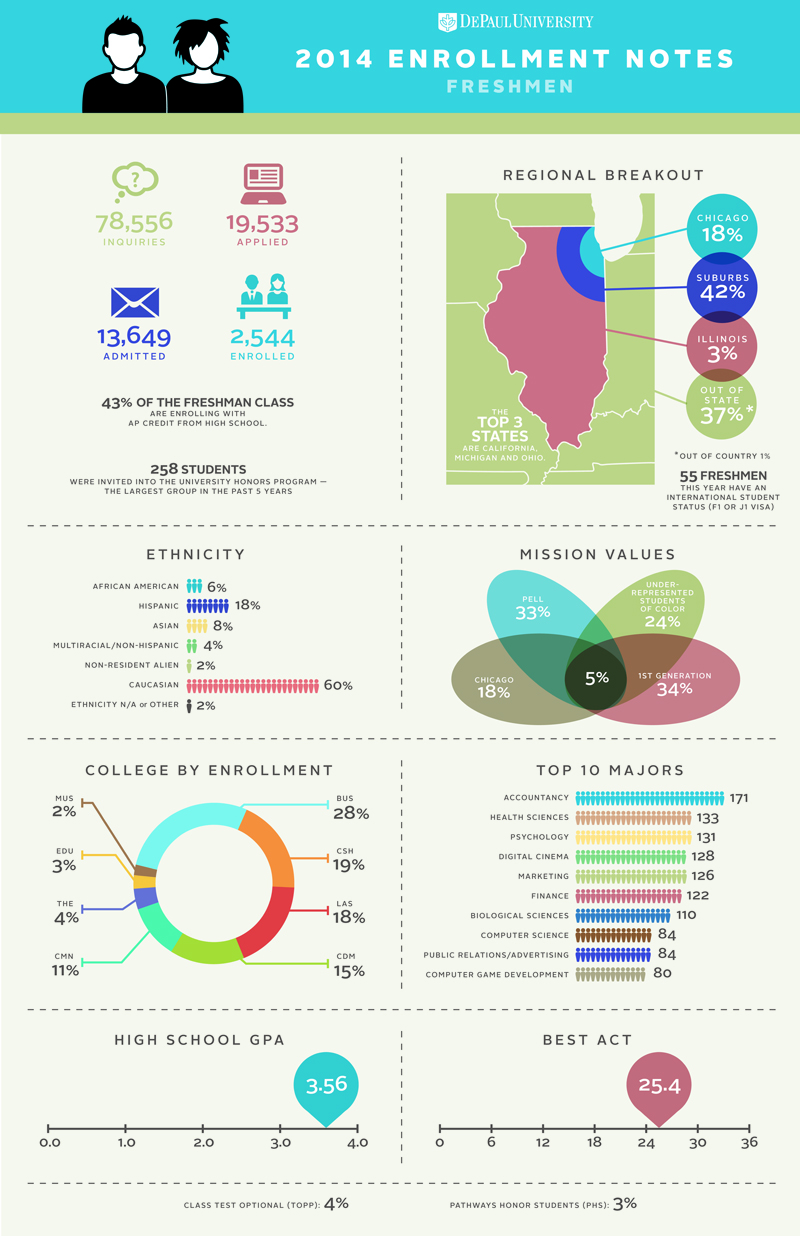
2014 Enrollment Notes: Freshmen
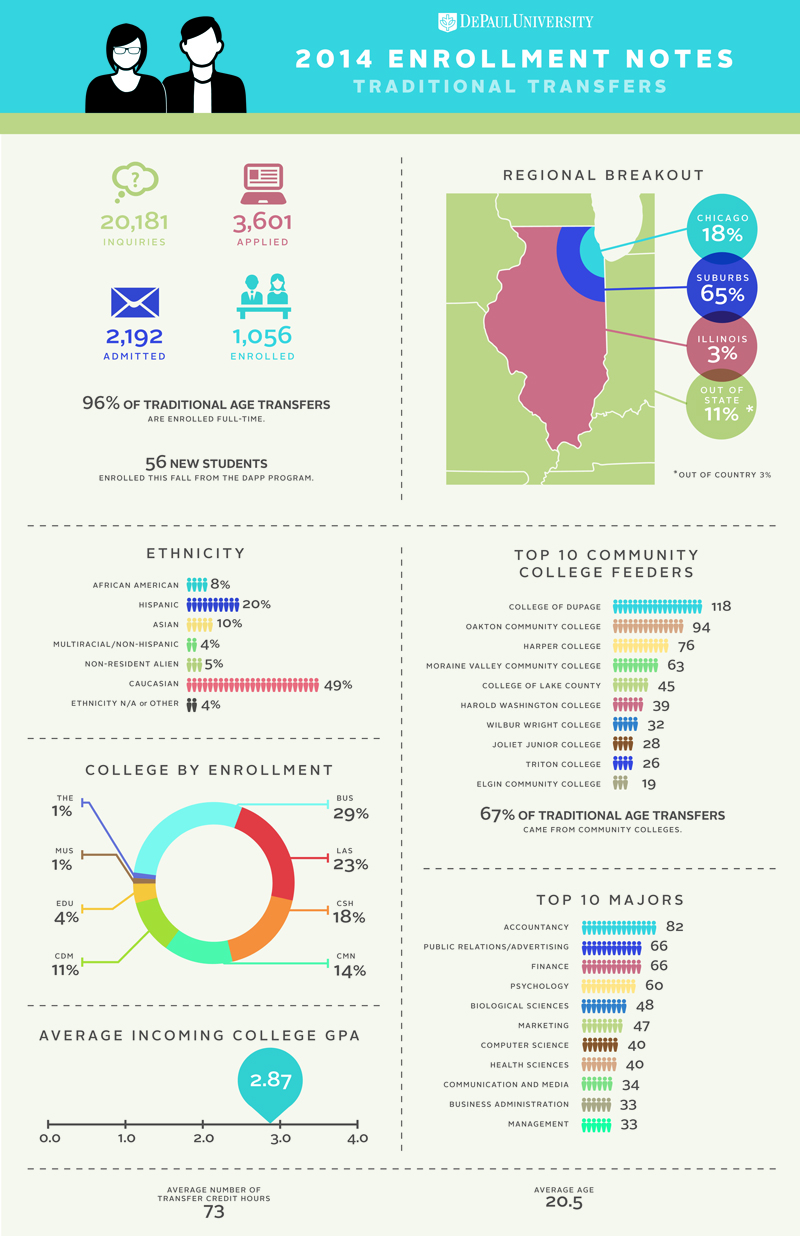
2014 Enrollment Notes: Traditional Transfers
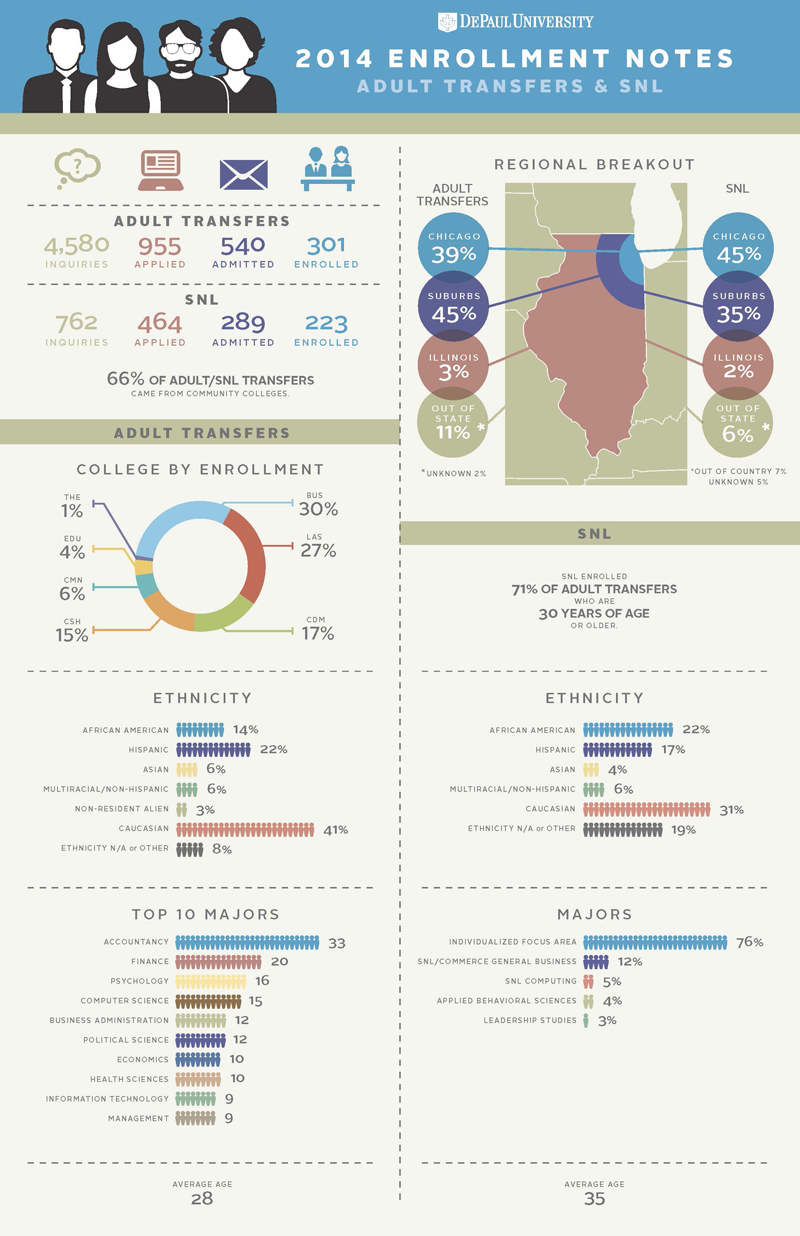
2014 Enrollment Notes: Adult Transfers and SNL
2014 New Undergraduate Enrollment